The District Dashboard gives you a high-level snapshot of how your Reading Intervention program is performing during a selected date range. It is best used for quickly identifying trends and areas that may need attention.
Accessing the District Dashboard
Select District Dashboard from the navigation tabs at the top of the Admin Center.
At the top of the page, select your district (if you oversee more than one) and adjust the date range. The default date range is the last 30 days.

District Overview
Service Delivery
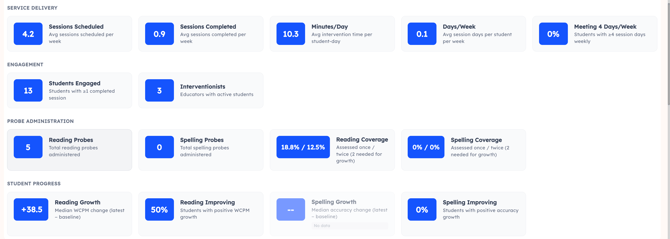
Sessions Scheduled vs. Sessions Completed
In the MTA curriculum, a lesson equals a session.
- Sessions Scheduled — Average number of sessions planned per week
- Sessions Completed — Sessions actually delivered
These metrics help you monitor intervention consistency and implementation fidelity.
Minutes Per Day
The average intervention time per student on days when they had a session. Sessions are capped at 90 minutes to prevent inflated data from extended log-ins.
Days Per Week
The average number of session days per student per week. Consistent delivery is critical for student growth.
Meeting 4 Days Per Week
The percentage of students who averaged intervention on 4 or more days per week. Structured literacy interventions are most effective when delivered at high frequency.
Engagement
Students Engaged — Number of students with one or more completed sessions.
Interventionists — Number of educators with active students.
Probe Administration
Reading Probes — Total reading probes administered.
Spelling Probes — Total spelling probes administered.
Reading Coverage — Percentage of students with 1 or more / 2 or more reading probes.
Spelling Coverage — Percentage of students with 1 or more / 2 or more spelling probes.
Coverage metrics help ensure students are being progress-monitored consistently.
Student Progress
Reading Growth (WCPM)
Median change in Words Correct Per Minute from a student's first probe (baseline) to their most recent probe. Only students with two or more probes are included. This metric supports IEP progress monitoring, dyslexia documentation, and MTSS data reviews.
Reading Improving — Percentage of students demonstrating positive WCPM growth.
Spelling Growth — Median change in spelling accuracy from baseline to most recent probe. Only students with two or more probes are included.
Spelling Improving — Percentage of students demonstrating positive spelling accuracy growth.
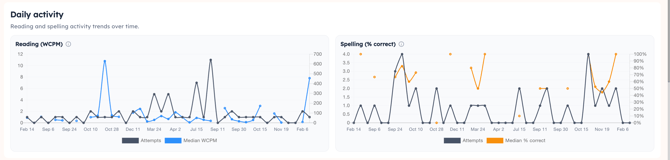
Daily Activity
View Reading and Spelling activity trends over time.
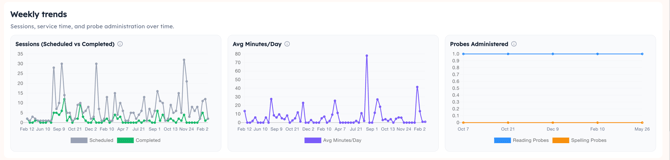
Weekly Trends
View sessions, service time, and probe administration over time.
Independent Practice
Tracks student self-practice completed outside of therapist-led sessions.
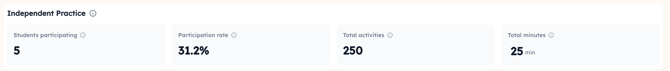
- Students Participating — Number of students who completed at least one independent practice activity
- Participation Rate — Percentage of students completing at least one independent practice activity
- Total Activities — Total independent practice activities completed
- Total Minutes — Total minutes spent on independent practice
Schools Table
The Schools table provides service delivery metrics broken down by school. Select any row to view educator-level data for that school.
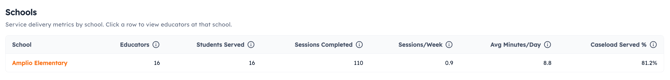
Columns include:
- Educators — Number of educators with assigned students
- Students Served — Students with at least one completed session
- Sessions Completed — Total sessions completed
- Sessions Per Week — Average sessions per week
- Average Minutes Per Day — Average minutes per student per day (capped at 90 minutes)
- Percentage of Caseload Served — Percentage of assigned students with at least one completed session
Interventionists Table
The Interventionists table provides per-educator metrics. Select an educator to open their detailed report.
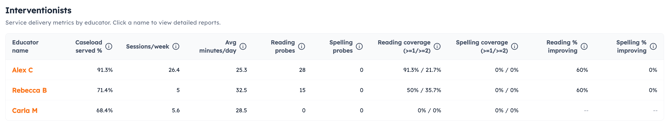
Columns include:
- Percentage of Caseload Served
- Sessions Per Week
- Average Minutes Per Day (capped at 90 minutes)
- Reading Probes Administered
- Spelling Probes Administered
- Reading Coverage (1 or more / 2 or more probes)
- Spelling Coverage (1 or more / 2 or more probes)
- Reading Percentage Improving
- Spelling Percentage Improving
Why Am I Not Seeing Data?
If metrics appear blank or show no data:
- Confirm the correct district is selected
- Check that the date range includes periods of student activity
- Confirm students have been assigned to the MTA curriculum
- Verify that probes have been administered
If you continue to have questions, contact your Amplio Customer Success representative.