The Reports tab provides deeper analytics tools for reviewing curriculum progress, tracking individual student status, and downloading probe reports. It is particularly useful for district reviews, ARD meetings, and leadership reporting.
Accessing the Reports Tab
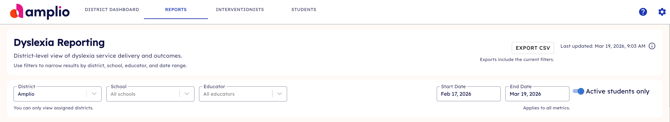
Select Reports from the navigation tabs at the top of the Admin Center.
At the top of the page, you can filter by district, school, and/or educator, and adjust the date range. The default date range is the last 30 days.
District Snapshot
The District Snapshot shows high-level metrics with a comparison to the previous time period, so you can see whether performance is improving, declining, or staying steady.
Metrics include:
- Sessions Scheduled and Completed (with period-over-period change)
- Sessions Per Week (with change)
- Average Session Minutes (capped at 90 minutes)
- Students Engaged (with change)
- Educators Engaged (with change)
Kit Progress
The Kit Progress section gives you a district-wide view of how students are progressing through the 7-kit MTA curriculum.
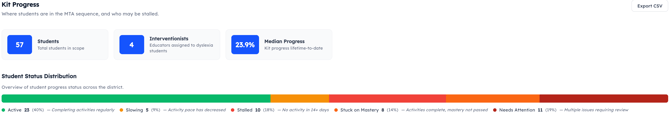
District-Level Metrics
- Total Students — Students in scope
- Total Interventionists — Educators with assigned students
- Median Progress Percentage — Lifetime-to-date kit progress across all students
Student Status
Every student is assigned one of five statuses based on their recent activity patterns. The status distribution bar at the top of the section shows how your students are distributed across these statuses at a glance. Select any segment to filter the student list below.
| Status | Color | What it means |
|---|---|---|
| Active | Green | Completing activities regularly |
| Slowing | Orange | Activity pace has decreased |
| Stalled | Red | No activity in 14 or more days |
| Stuck on Mastery | Orange-Red | Activities complete, mastery check not yet passed |
| Needs Attention | Dark Red (pulsing) | Multiple issues flagged simultaneously |
Kit Funnel
The Kit Funnel shows you exactly where students are progressing through each of the 7 MTA kits — and where they are getting stuck.
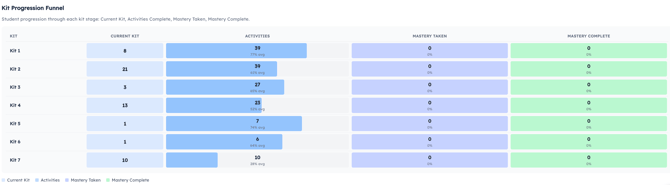
For each kit, you will see:
- Started — Students with any activity in that kit
- Activities Complete — Students who finished all kit activities
- Mastery Taken — Students who attempted the mastery check
- Mastery Passed (80%+) — Students who passed the mastery check
This view helps identify where coaching, scheduling adjustments, or reteaching may be needed.
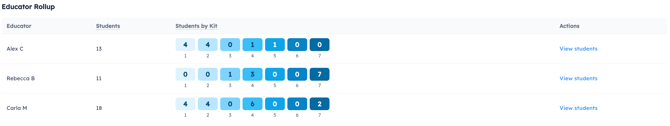
Educator Rollup
The Educator Rollup provides a per-educator breakdown showing student count and how that educator's students are distributed across all 7 kits.
Student Progress Table
The Student Progress table shows individual student details with search, filtering, and sorting options.
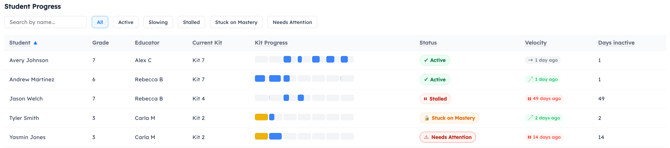
For each student you can see:
- Name and grade
- Assigned educator
- Kit Progress Bar — A 7-segment visual bar showing completion status per kit. Hover over the bar to see kit-level activity detail.
- Status Badge — Color-coded current status (see Student Status table above)
- Velocity Indicator — Whether the student's pace is increasing or decreasing compared to the prior 4 weeks
Velocity indicators:
| Indicator | Color | Meaning |
|---|---|---|
| ↗ Accelerating | Green | Activity rate increasing |
| → Steady | Gray | Consistent pace |
| ↘ Slowing | Orange | Activity rate declining |
| ⏸ Stalled | Red | No recent activity |
Probe Data
The Probe Data section displays a summary of reading and spelling growth, along with total probes administered across your district.
Educator & Caseload
This section surfaces workload and service delivery data for each educator, including automatic outlier detection.
| Flag | Color | Meaning |
|---|---|---|
| Below Expected | Blue | Educator is below 30% caseload served |
| Above Expected | Orange | Educator is above 250% caseload served |
| Needs Attention | Red | Multiple flags present |
Downloading Probe Reports
On the Reports tab, you can download probe reports for the currently filtered group of students.
Select Download All Reading PDFs or Download All Spelling PDFs to generate a single merged PDF containing all reading or spelling probe reports for the filtered student set. This is useful for:
- IEP documentation
- Dyslexia program files
- Progress monitoring meetings
Why Am I Not Seeing Data?
If metrics appear blank:
- Confirm the correct district and school filters are selected
- Check that the date range includes periods of student activity
- Confirm students have been assigned to the MTA curriculum
- Verify that probes have been administered
If you continue to have questions, contact your Amplio Customer Success representative.